

Anthropic goes public today. Have you read the prospectus? Neither had we. It's 430 pages long. It lists the financials, 88 risk factors, a board structure built on three classes of stock, and enough defined terms to need a glossary. It's a wall of boring, technical text.
We still wanted to know what it said. So we gave the PDF to Claude with Basic Memory connected and asked it to show us the information in a way that's actually helpful.
What happens to the PDF?
Basic Memory converted all 430 pages into Markdown, plain text that you and your AI can both read. The original PDF stays next to it.
Then Claude broke the filing into notes: one for each risk factor, each company and person, each financial metric, each defined term. Claude wrote the printed page number into every note, so you can check any claim against the filing.
The notes link to each other. The note for Amazon says it supplies Anthropic, partners with it, and invests in it, and each of those is a link you can follow. Where a few pages of prose were hard to follow, Claude drew them as a chart, a timeline, or a diagram.
The result is a public Wiki anyone can open. It's interesting, and you can actually read it. Your AI gets knowledge that's already organized and cited, so it can answer questions without rereading 430 pages.
What can you ask it?
Anything the filing answers. Here's a good one to try:
What are all the existential risks raised in the prospectus?
We asked Claude. It searched the notes, opened the risk factors that matched, and answered with page numbers:
| What the filing says | Where |
|---|---|
| AI risk falls into four categories: misuse, loss of control, authoritarian abuse, and economic disruption | Founders' letter, PDF p. 5 |
| Models have acted, and may act, in misaligned or autonomous ways. Researchers and regulators have raised concerns that advanced AI could pose catastrophic or existential risks to humanity | Risk factor R01, p. 30 |
| Bad actors may misuse the models, and safeguards may fail to stop them | R13, p. 50 |
| A catastrophic AI incident could exceed what any insurer can cover | R14, p. 52 |
| More autonomous systems could take harmful actions at scale without human intervention | R15, p. 54 |
| Media narratives that AI poses existential risk could hurt the business | R42, p. 86 |
Ask your agent to save that answer and it becomes a note in the Wiki, with its citations, so the next person who asks doesn't start from scratch.
To check that this holds up beyond one question, we wrote 49 questions about the filing and gave them to a separate agent that had only the notes. It found an answer to each one, usually in two tool calls. The questions, answers, and page citations are in the Wiki.
Where do the charts come from?
New in Basic Memory 1.0, a note can draw. Here's something the filing takes several dense paragraphs to explain. After the IPO, who chooses Anthropic's board?
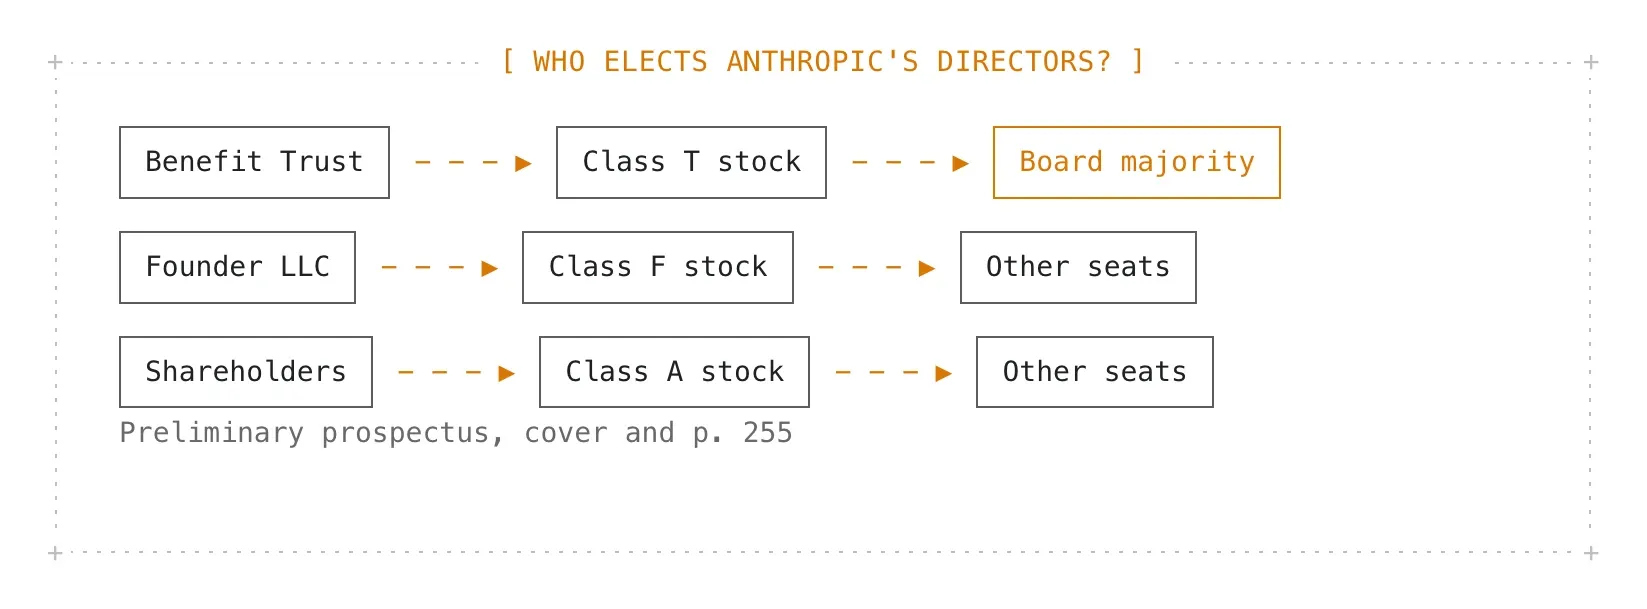
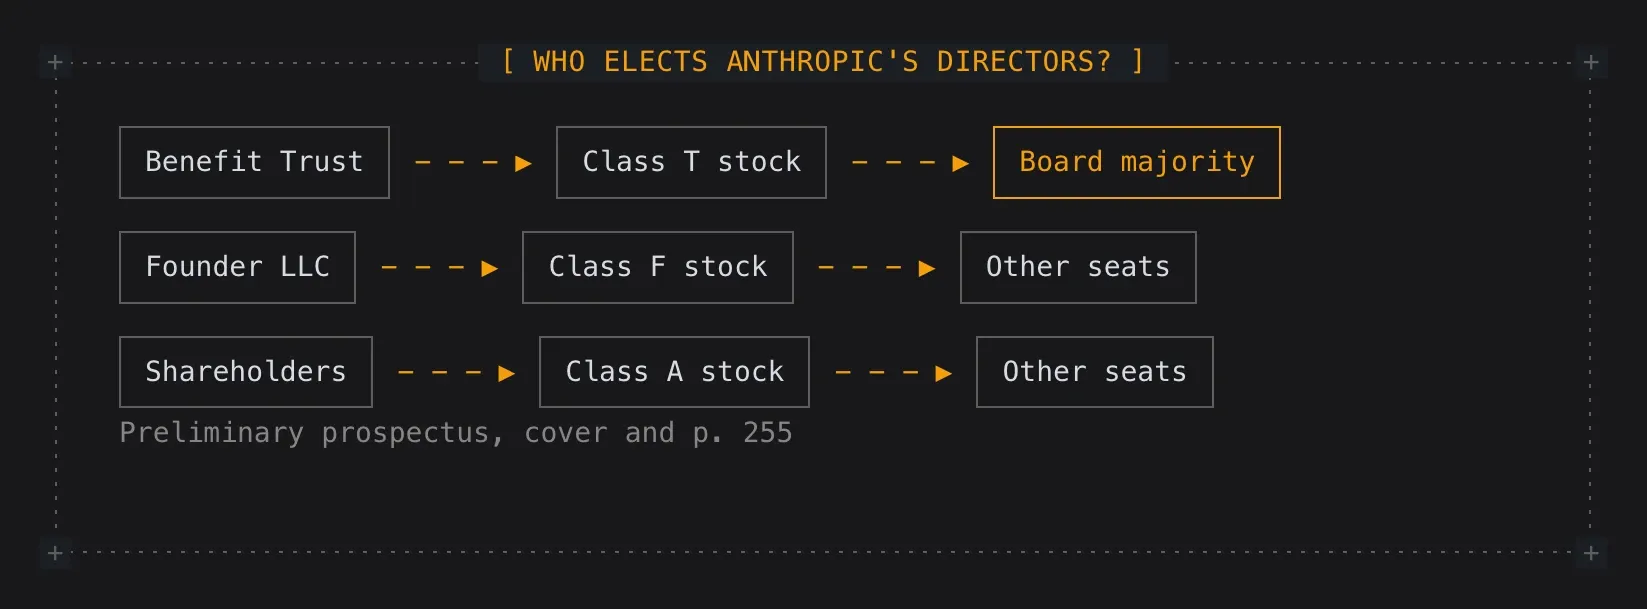
The Long-Term Benefit Trust holds Class T stock and elects most of the directors. Class F and Class A vote together on the remaining seats, and the founders' Class F stock carries 50.1% of that vote.
Here is everything it took to draw that diagram:
::bm-flow{title="Who elects Anthropic's directors?"}
- Benefit Trust → Class T stock → **Board majority**
- Founder LLC → Class F stock → Other seats
- Shareholders → Class A stock → Other seats
::
One line per path, arrows between the steps, bold on the part that matters.
How do I make a chart like this?
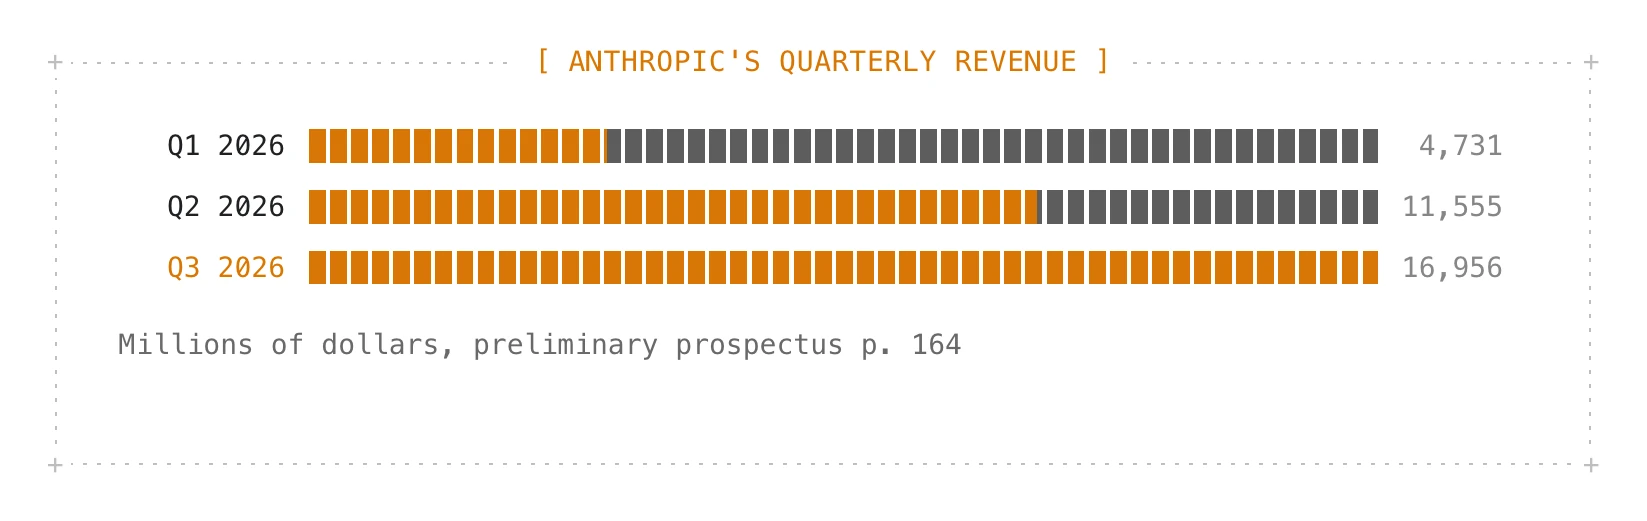
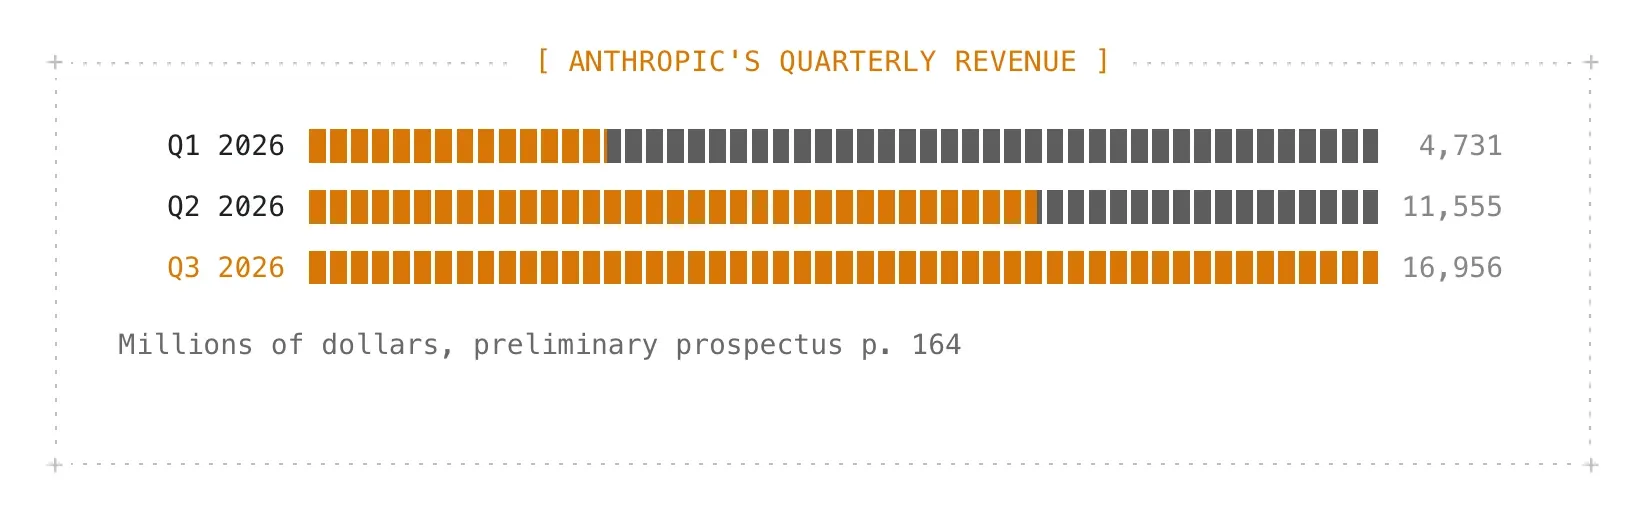
Realistically, ask your AI to do it. Start with a list. Here's Anthropic's revenue for the last three quarters in the filing, from page 164:
::bm-bars{title="Anthropic's quarterly revenue" caption="Millions of dollars, p. 164"}
- Q1 2026: 4,731
- Q2 2026: 11,555
- **Q3 2026: 16,956**
::
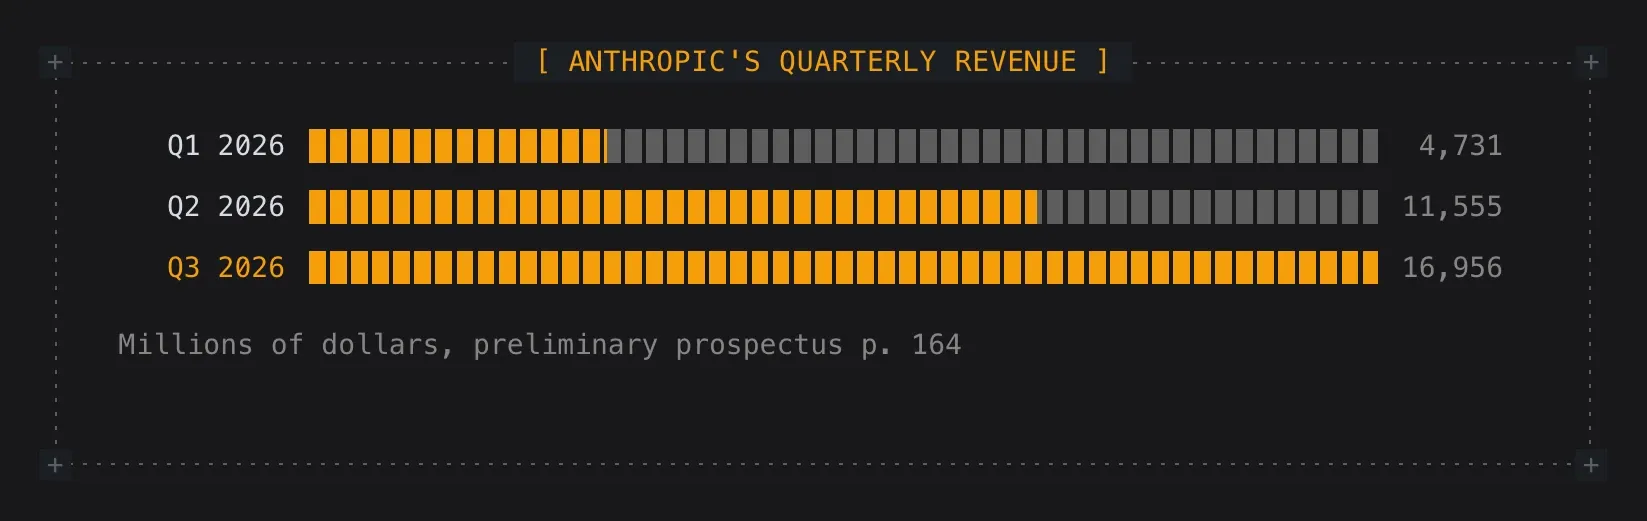
Want to learn to do it yourself? Here it is line by line:
::bm-barspicks the component. There are 39. This one draws bars.- The braces hold settings, here a title and a caption.
- The list is the data. Each line is a label, a colon, and a number.
- Bold highlights a bar.
::ends the component.
The syntax is Comark, an open format for components in Markdown. Open this note in any text editor and you'll see a short list of revenue figures. Ask your AI to add next quarter and it adds a line, the same way you would.
Can a chart keep itself up to date?
That's the best part. The charts so far draw numbers someone typed. A live view draws numbers nobody typed. It reads your notes and redraws whenever they change.
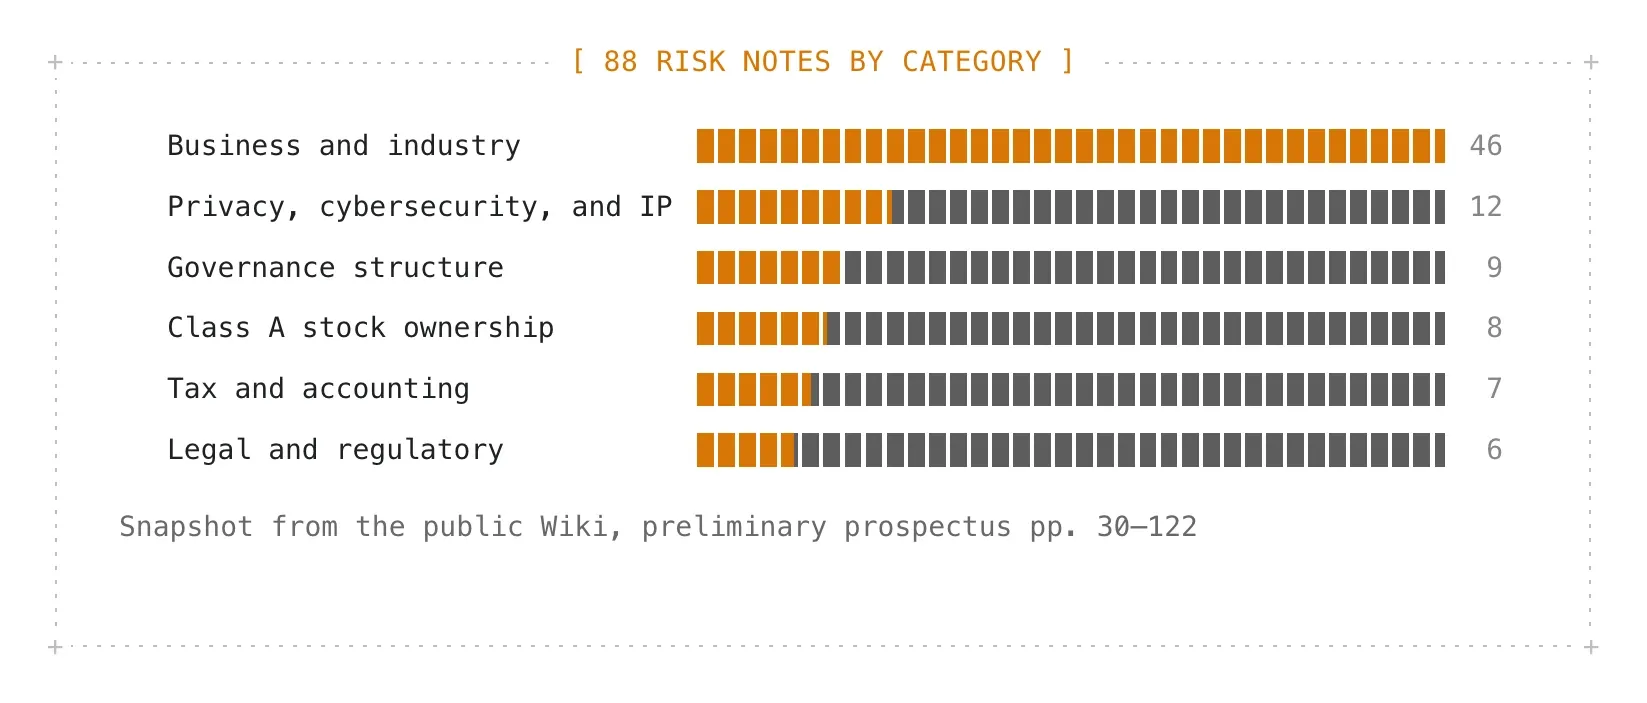
When Claude built the Wiki, it wrote 88 risk notes and labeled each one with a category at the top. Here's the top of one:
type: risk
category: Risks Related to our Business and Industry
page: '72'
Nobody counted them. This chart does:
::bm-bars{title="Risk notes by category" query="notes | where type == risk | group category | sort count desc"}
::
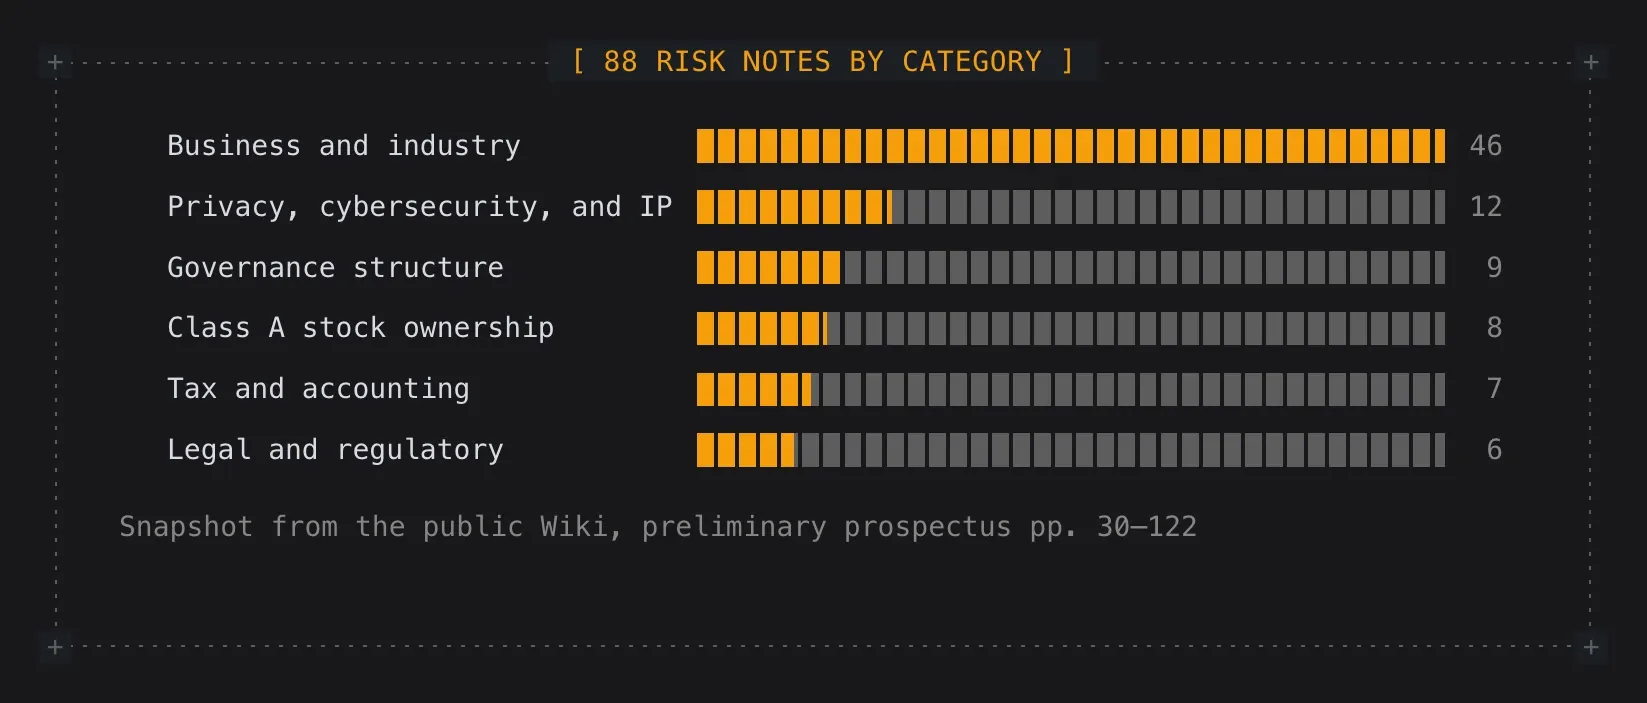
Read it left to right: take the notes, keep the risks, group them by category, biggest group first. Add a risk note and its bar grows the next time the page opens. Here's what it shows in the Wiki today, with shorter labels:
The same works on your own notes. If your tasks have a status, then notes | where type == task | group status is a status board that never needs updating.
Can my AI read the charts?
Yes, because they're text. An AI reading the revenue note sees "Q3 2026: 16,956." It doesn't have to squint at a picture. The same note works for both of you: you get the chart, and your AI gets the numbers.
If your browser has an AI agent that supports WebMCP (it's experimental, and in Chrome it needs the WebMCP testing API turned on), the public Wiki hands it tools when you open it. Your agent can search the Wiki, read any page (including the original PDF's text), follow links, and run the same kind of query as the live chart: notes | where type == risk | group category. It's read-only, and you don't need an account.
Try it
Open the prospectus Wiki. Pick a chart, open the note behind it, and check the page number against the filing. When you want to make your own, the Comark playground has every component with source you can edit.
To build a Wiki like this from your own documents, try Basic Memory free.
Source: Anthropic's preliminary prospectus dated November 10, 2026. This post describes a public filing. It isn't investment advice.